NFL Player Props Strategy: Targeting Yardage and Touchdown Markets
 Available in US
Table of Contents
- Player Prop Inefficiencies: Capitalizing on Statistical Projections
- Rushing and Receiving Yardage Props: Where the Lines Lag
- Anytime Touchdown Scorer: Pricing, Variance and Value Spots
- Quarterback Passing Props: Attempts, Yards and Completions
- The Research Checklist: What to Look Up Before Backing a Prop
Player Prop Inefficiencies: Capitalizing on Statistical Projections
I discovered player props by accident. A colleague in Dublin who traded NFL lines for a mid-tier European bookmaker once mentioned, almost offhandedly, that prop markets were the last to be adjusted when team news broke. He wasn’t exaggerating. Prop lines — individual player yardage, touchdowns, receptions — are set using models that rely on season-long averages and generic usage rates. They’re slower to react to matchup-specific information, injury cascades, and game-script projections than the spread or totals markets. That information lag is your edge.
The growth of BetBuilder products at UK bookmakers — same-game parlays climbed from 29% to 34% of NFL volume at Paddy Power between 2023 and 2024 — has driven massive expansion in prop market availability. Every major UK platform now offers rushing yards, receiving yards, passing yards, touchdowns, receptions, completions, and sometimes even tackles and sacks. More markets mean more lines, more lines mean more mispricing, and more mispricing means more opportunity for bettors who do their homework.
The structural inefficiency comes from scale. A bookmaker’s NFL trading team devotes the most attention to the moneyline, spread, and total for each game — the three highest-volume markets. Player props sit further down the priority list. Individual prop lines might be reviewed once on Thursday and not touched again unless a major injury breaks. Between that review and Sunday kickoff, matchup information accumulates — defensive personnel changes, practice reports, weather updates — that the prop line doesn’t reflect.
Rushing and Receiving Yardage Props: Where the Lines Lag
Yardage props are my bread and butter. They’re set based on a player’s season average, adjusted lightly for opponent strength. But “opponent strength” in the bookmaker’s model often means the defence’s overall ranking — not their performance against the specific style of player you’re betting on.
Here’s a real pattern I’ve exploited repeatedly. Take a running back who averages 65 rushing yards per game. His prop line is set at 64.5. Seems about right — until you notice this week’s opponent allows the third-most rushing yards to backs who run between the tackles, and this back gets 80% of his carries between the tackles. His average includes games against top-5 run defences where he managed 35 yards. Strip those out, and his average against bottom-half run defences is 82 yards. The line at 64.5 doesn’t capture that matchup-specific reality.
The New England Patriots’ dramatic EPA/play improvement in 2025 — from -0.095 to +0.119, a swing of +0.214 — created exactly this kind of opportunity for prop bettors who noticed it early. As the Patriots’ offensive efficiency surged, individual player props lagged behind because the models were still anchored to the prior season’s miserable output. Bettors who recognised the efficiency gain and bet overs on Patriots’ skill position players captured several weeks of mispriced lines before the bookmakers recalibrated.
Receiving yardage follows the same logic but with an additional variable: target share. A wide receiver’s yardage depends not just on his talent and the opposing secondary’s quality, but on how many targets he commands within the offence. Target share shifts week to week based on injuries to other receivers, game script expectations, and defensive coverage schemes. If the opposing team’s best cornerback is injured and your receiver’s target share is likely to spike, the yardage prop — which doesn’t account for that specific coverage adjustment — becomes a value bet.
Anytime Touchdown Scorer: Pricing, Variance and Value Spots
Touchdown props are the most popular player prop among casual bettors and the trickiest market for sharps. The appeal is obvious: “Will Player X score a touchdown?” is a simple yes/no question with clear visual drama. The problem is that touchdowns are inherently high-variance events. A player can dominate between the 20-yard lines all game and never cross the goal line. Another player might touch the ball three times and score twice.
Anytime touchdown scorer pricing at UK bookmakers typically ranges from 1.40 (heavy favourite, think a lead back for a dominant offence) to 5.00+ (a third-string receiver or a fullback). The value isn’t in the most-likely scorers — those are priced efficiently because they attract the most volume. The value sits in the middle tier: players priced between 2.20 and 3.50 who have a matchup-specific reason to score.
Red zone opportunities are the critical variable. A running back who gets 60% of his team’s carries inside the 10-yard line is a touchdown machine in the right matchup. A receiver who leads his team in red zone targets per game has an elevated scoring floor. These usage patterns are publicly available but rarely reflected in the headline pricing. Check red zone target share and red zone carry share before backing any touchdown scorer prop — it’s the single most predictive statistic for this market.
One discipline note: I never build a prop strategy around touchdown scorers alone. The variance is too high for consistent profitability. I treat TD scorer bets as supplements to yardage props, not replacements. If my yardage analysis also points toward a scoring opportunity, the TD bet becomes a secondary play at a reduced stake.
Quarterback Passing Props: Attempts, Yards and Completions
Quarterback passing props attract enormous volume, which means bookmakers price them more carefully than running back or receiver props. The edge here is thinner, but it exists — particularly in the attempts and completions markets rather than yardage.
Passing yardage is the most heavily bet QB prop, and it’s priced accordingly. Bookmakers have sophisticated models for projected passing yards that incorporate defensive DVOA, pace, and game script expectations. Finding consistent mispricing here is hard.
Pass attempts, though, are a different story. Attempt projections depend heavily on game script, and game scripts are inherently uncertain. If a team that’s expected to be trailing (the underdog) falls behind early, their pass attempts spike as they abandon the run. The attempt prop, set based on average volume, doesn’t fully price in the probability of a negative game script. I’ve found that backing overs on pass attempts for underdogs of 4+ points has positive expected value, especially when the opposing offence is efficient enough to build an early lead.
Completions follow a similar dynamic but with an additional wrinkle: completion percentage varies significantly by receiver health and weather. A quarterback missing his two top possession receivers will see his completion rate drop even if attempt volume stays constant. If the completions prop hasn’t adjusted for a receiver’s absence, the under becomes attractive.
The Research Checklist: What to Look Up Before Backing a Prop
After nine years of refining my process, I’ve condensed prop research into five steps that I run through before placing any player prop bet. It takes about 15 minutes per game, and it’s the difference between informed betting and guessing.
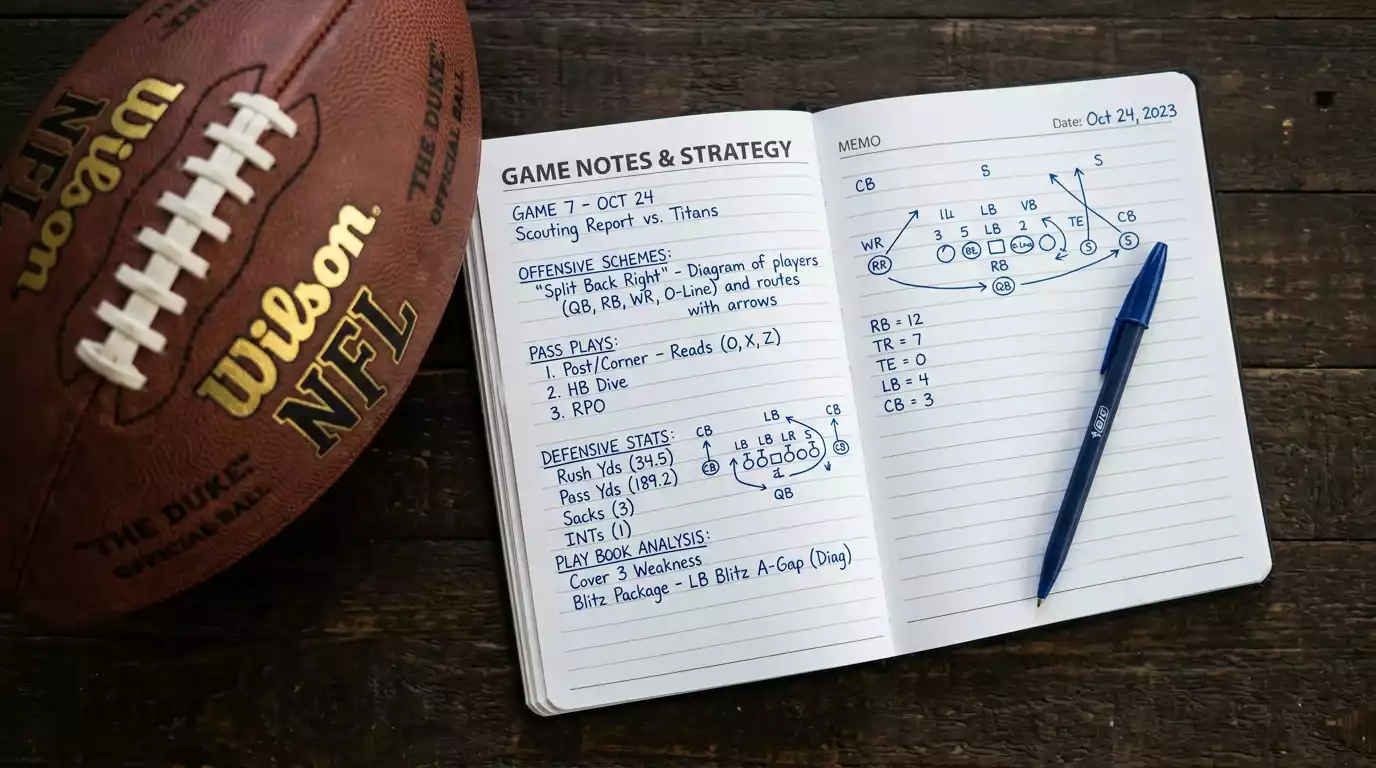
Step one: check the player’s usage data against this specific defensive scheme. Not overall defence ranking — scheme-specific. Is the opposing defence vulnerable to inside runs, outside zones, short passes, or deep shots? Match the player’s role to the defensive weakness.
Step two: check injury reports for both teams. A teammate’s absence can boost a player’s volume (more targets, more carries). An opposing defender’s absence can boost efficiency (more yards per touch). Both affect prop outcomes, and both are often incorporated into lines slowly.
Step three: project the game script. Is this player’s team likely to lead, trail, or play a close game? Leading teams run more and pass less. Trailing teams pass more and run less. The prop line is set to an average that doesn’t fully weight this week’s specific script projection.
Step four: check advanced metrics for recent performance trends. EPA/play, success rate, and target share over the past three games matter more than season-long averages for projecting this week’s output. A player trending upward in efficiency against a softening defensive schedule is the ideal prop target.
Step five: compare the prop line across at least three UK bookmakers. Price variation on props is wider than on spreads or totals — sometimes dramatically so. I’ve seen the same rushing yard prop set at 59.5 at one platform and 64.5 at another. That 5-yard gap is the difference between a value bet and a bad one. Never settle for the first price you see.
Which type of NFL player prop has the softest lines?
Rushing and receiving yardage props are consistently the softest because bookmakers set them using season-long averages with limited matchup-specific adjustment. The lines lag behind changes in usage, defensive personnel, and game-script projections. Quarterback passing yards, by contrast, attract more betting volume and receive closer attention from bookmakers, making those lines sharper and harder to beat.
How do I research NFL player props before placing a bet?
Focus on five areas: scheme-specific defensive vulnerability (not overall defence ranking), injury reports for both teams (teammate absences boost volume, opposing defender absences boost efficiency), projected game script (leading vs. trailing affects play-calling mix), recent advanced metrics trends over the past three games, and price comparison across at least three UK bookmakers. This process takes about 15 minutes per game and identifies mispriced lines more reliably than relying on gut feeling or season averages alone.
Published by the nfl Betting Strategies team.