NFL Closing Line Value: Tracking CLV Metrics and Market Edges
 Available in US
CLV Validation: Measuring True Edge Over Bookmaker Odds
The most dangerous trap in NFL betting is a hot streak. You win 8 out of 10 bets in weeks 3 and 4, feel invincible, increase your stakes in week 5, and proceed to lose 6 straight. Was the hot streak skill? Was the cold streak bad luck? Win rate alone can’t answer that question — not over 10 bets, not over 50, not even over 200. The variance in NFL outcomes is large enough that a 50% bettor can look like a 65% bettor for an entire month purely by chance.
That’s where closing line value enters. CLV measures whether you consistently beat the market’s final price — the closing line at kickoff. Bettors who are CLV-positive demonstrate ROI two to three times higher than those who only track win rate. The reason is fundamental: the closing line is the most efficient price in the market because it incorporates all available information, including sharp money, late injury news, and weather updates. If you’re consistently getting better prices than the closing line, you’re identifying value that the sharpest money in the market eventually confirms. That’s the closest thing to proof of genuine skill that exists in sports betting.
What Closing Line Value Means and How Bookmakers Set It
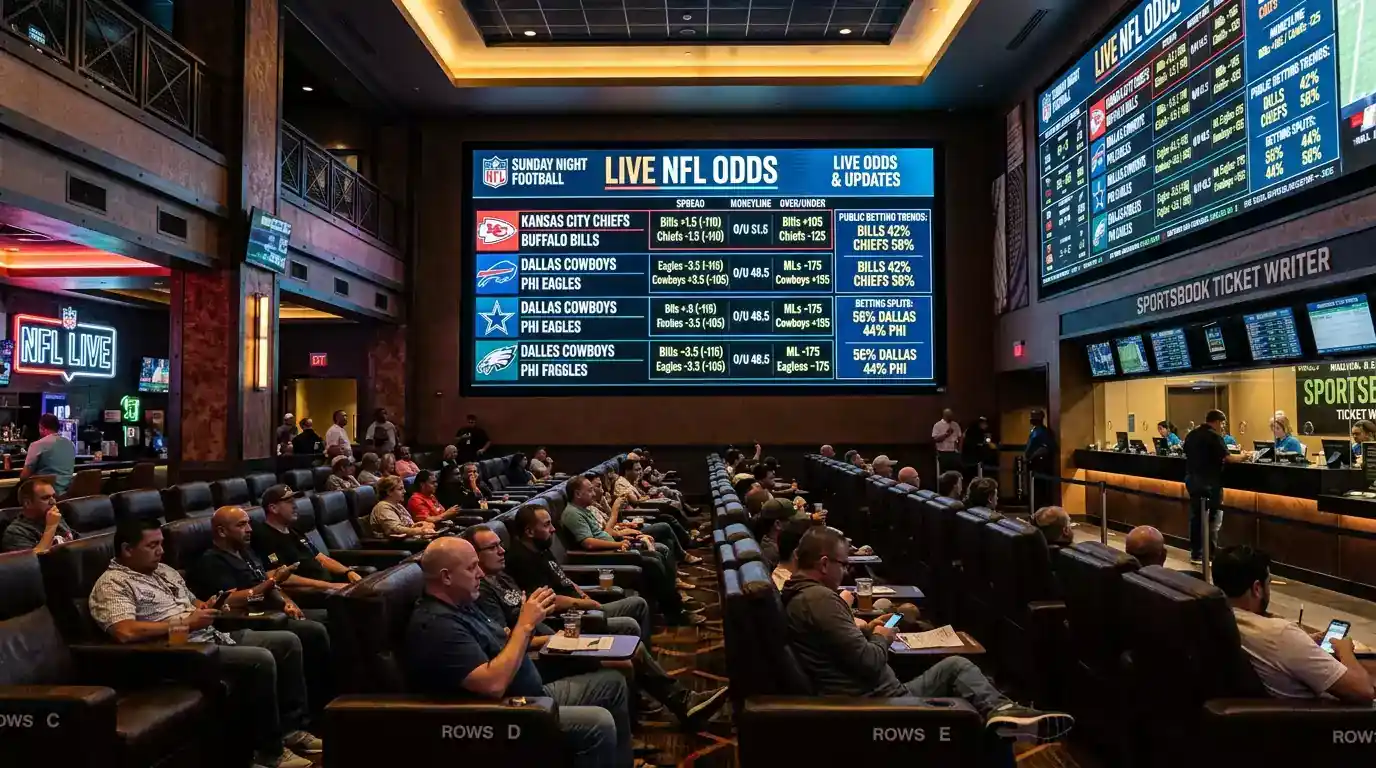
Every NFL line has a lifecycle. It opens on Sunday evening or Monday morning — sometimes called the “look-ahead” line — and then evolves through the week as information enters the market. Sharp bettors place early. Injury reports trickle in. Weather forecasts update. Public money arrives late, typically on Saturday and Sunday morning. The line at kickoff — the closing line — represents the market’s final consensus on the probability of each outcome.
CLV is the difference between the price you got when you placed your bet and the closing price at kickoff. If you bet the Bills +3.5 at 1.91 on Tuesday and the line closes at Bills +2.5 at 1.91 on Sunday, you captured one full point of value. The market moved toward your position, confirming that your early assessment was correct. You got a price the market no longer offered by game time.
If the opposite happened — you bet Bills +3.5 and the line closed at +4.5 — you got a worse price than the market’s final assessment. The line moved away from your position. This doesn’t mean your bet was wrong (the Bills might still cover +3.5), but it means the market disagreed with your timing or your side, and over time, bettors who consistently get worse prices than the closer lose money.
Bookmakers understand this dynamic intimately. Some actively monitor for CLV-positive bettors and restrict their accounts. If your betting pattern consistently beats the closing line, the bookmaker knows you’re extracting value from their market, and they’ll limit your maximum stakes or close your account entirely. It’s frustrating, but it’s also the strongest validation of your skill as a bettor. Being limited is a compliment, even if it doesn’t feel like one.
How to Calculate Your CLV After Every NFL Bet
Calculating CLV is straightforward once you build the habit. After every game kicks off, record two numbers: the odds you got and the closing odds on the same selection. The difference is your CLV.
For spread bets at standard pricing (1.91 on both sides), CLV is best measured in points rather than odds. If you got +3.5 and the line closed at +3, your CLV is +0.5 points. If you got -7 and it closed at -7.5, your CLV is also +0.5 points (you got a better number). Simple, consistent, and easy to track in a spreadsheet.
For moneyline bets where the odds shift, convert the difference into implied probability. You bet Team A at 2.50 (40% implied) and the line closed at 2.30 (43.5% implied). The market’s final assessment was that Team A had a 43.5% chance of winning, but you got a price that implied only 40%. Your CLV is +3.5 percentage points of implied probability. That’s significant — over a season, consistent CLV of 2-3 points translates to meaningful positive ROI.
The breakeven point for standard spread bets sits at 52.38%. If your average CLV across a full season is positive — even by half a point — you’re operating on the right side of the market. The maths is unforgiving but honest. A bettor with a 54% win rate and no CLV might be running hot. A bettor with a 51% win rate and consistent positive CLV is genuinely skilled and will profit over time as variance smooths out.
CLV vs. ROI: Which Metric Tells the Real Story?
Billy Walters made this point sharply: the way betting is set up, most people have no chance of winning. Zero. What he didn’t say explicitly — but what his own career demonstrated — is that the bettors who do win are the ones who focus on process metrics rather than outcome metrics. CLV is the ultimate process metric. ROI is an outcome metric. They measure different things, and confusing them is a recipe for poor decisions.
ROI tells you how much money you’ve made or lost as a percentage of your total stakes. It’s the bottom line. But in NFL betting, ROI is unstable over small samples. A 200-bet sample — roughly one and a half seasons of active betting — can show ROI fluctuations of +15% to -10% for a bettor with a true edge of +3%. That’s enormous noise. You can be genuinely skilled and show a negative ROI for an entire season because of how the touchdowns fell.
CLV stabilises much faster. Because it measures your price relative to the market’s final assessment rather than the binary win/loss outcome, it strips out the noise of individual game results. A bettor who averages +1.5 points of CLV per bet across 150 wagers has a statistically meaningful signal. The same bettor’s ROI over those 150 wagers might be positive or negative depending on variance — but the CLV tells you the skill is there.
My recommendation: track both, trust CLV. If your CLV is consistently positive but your ROI is lagging, you’re running unlucky. Stay the course. If your ROI is positive but your CLV is negative, you’re running hot. Be cautious — the correction is coming. CLV doesn’t lie. It can’t. It’s just maths comparing your price to the market’s best price.
Adding CLV to Your Betting Log: A Practical Setup
If you’re not already tracking CLV in your betting log, adding it takes five minutes of setup and about 30 seconds per bet after each game kicks off.
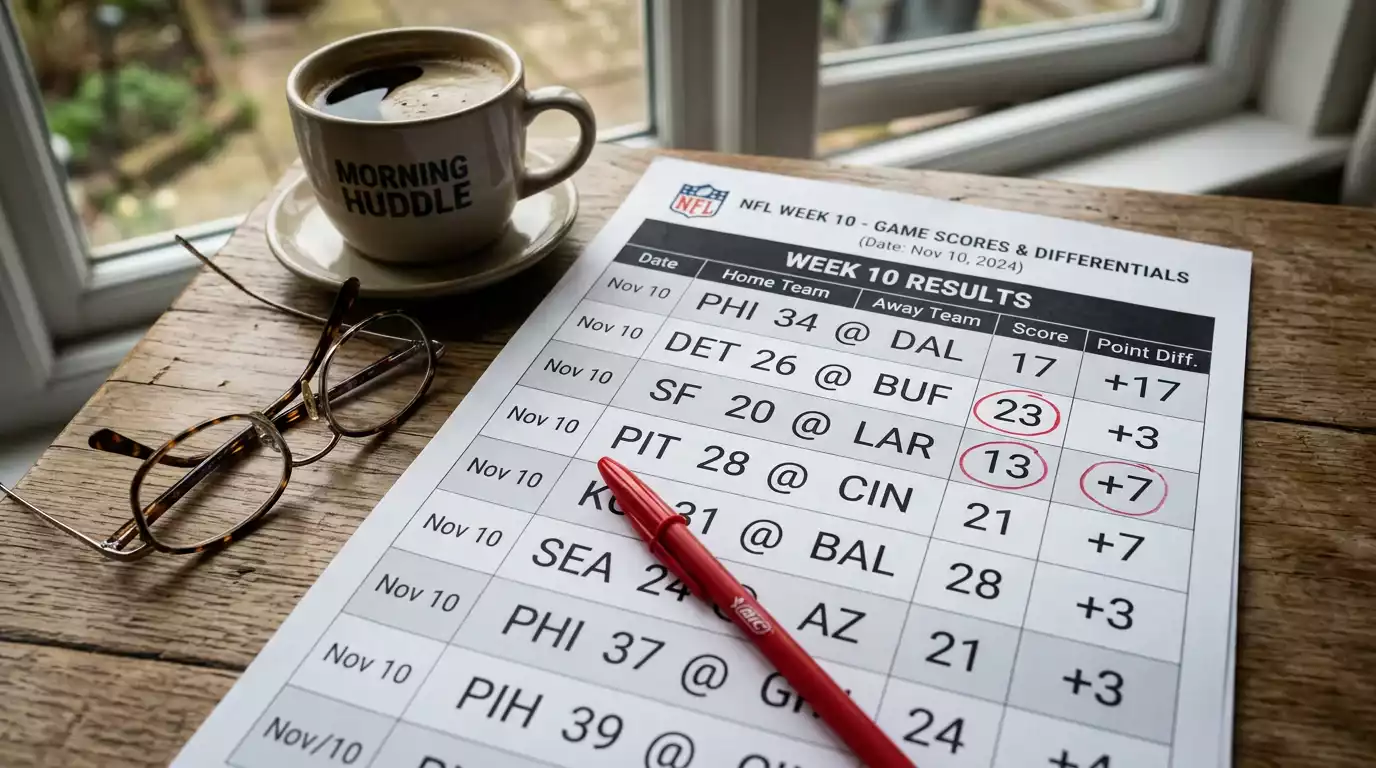
Create two new columns in your spreadsheet: “Closing Line” and “CLV.” After you place each bet, leave the Closing Line column blank until kickoff. Then check your bookmaker’s market (or a line-tracking service) and record the final odds on your selection. Calculate CLV as the difference between your price and the closing price, expressed in points for spreads or percentage points of implied probability for moneylines.
At the end of each week, calculate your average CLV across all bets placed that week. At the end of each month, calculate the cumulative average. Plot it over time. What you’re looking for is a consistently positive line on that graph. Dips are normal — some weeks the market moves against you. But the trend should be upward if your handicapping process is sound.
One practical detail: use the closing line from the bookmaker where you placed the bet, not from a different platform. Lines can vary by half a point or more across bookmakers at close, and using a different platform’s closing line introduces measurement error. Your CLV should reflect the specific market you’re competing against.
Over time, your CLV data will reveal patterns. You might discover that your CLV is strongest on underdogs but weakest on favourites — suggesting your edge lies in identifying undervalued dogs. You might find that your Tuesday bets have higher CLV than your Sunday morning bets — meaning you’re better at reading early lines than reacting to late information. These patterns are goldmines for refining your process, and they’re invisible without CLV tracking. No other metric gives you this level of diagnostic precision.
How much closing line value do I need to be a long-term profitable NFL bettor?
Consistent positive CLV of 1-2 points on spread bets, or 2-3 percentage points on moneyline implied probability, is sufficient for long-term profitability. Even half a point of average CLV across a full season signals genuine skill. The key word is consistent — a few big CLV wins don’t matter if the average across hundreds of bets hovers near zero. Track your cumulative CLV over at least 100 bets before drawing conclusions about your edge.
Can I track CLV using free tools or do I need a paid service?
A simple spreadsheet is sufficient. After each bet, record your odds at placement and the closing odds at kickoff from the same bookmaker. Calculate the difference in points (for spreads) or implied probability percentage (for moneylines). No paid software is required. Some free line-tracking websites also archive closing lines across multiple bookmakers, which saves time. The discipline of recording data consistently matters more than the sophistication of the tool you use.
Created by the ”nfl Betting Strategies” editorial team.