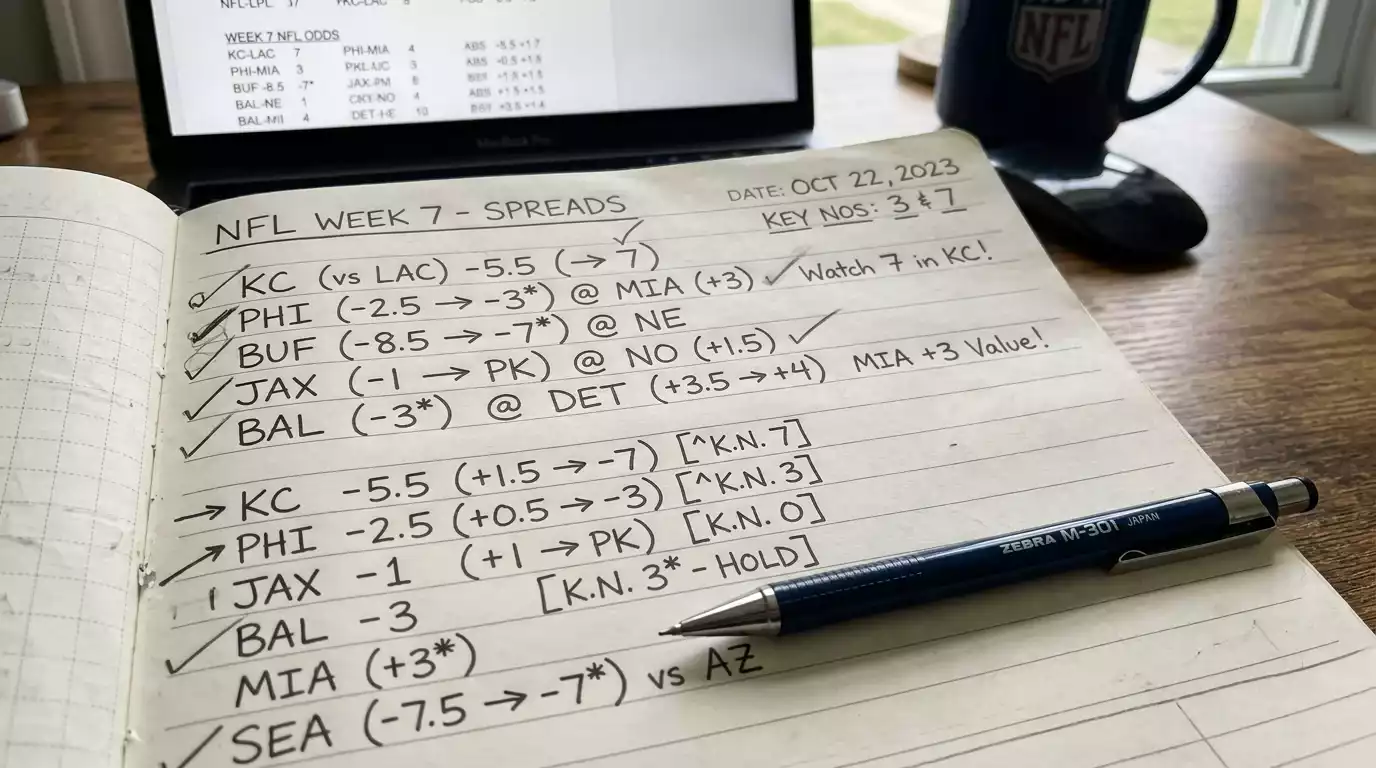
NFL Bet Tracking Spreadsheet: Monitoring CLV and Betting ROI
 Available in US
Data Logging Methodologies: Structuring Your Betting Performance Review
I started tracking my bets in 2017 because a more experienced bettor told me I was kidding myself about my win rate. He was right. I’d been mentally rounding up my winners and quietly forgetting my losers — a psychological pattern so common it has a name in behavioural economics: selective recall. Within a month of honest tracking, I discovered my actual ATS win rate was 49.2%, not the 55% I’d been telling people at the pub. That single spreadsheet saved me from years of delusional, unprofitable betting.
CLV-positive bettors demonstrate ROI two to three times higher than those who track only win rate — but you can’t measure CLV, or any other process metric, without a structured log. Most bettors skip tracking because it feels tedious, because it exposes uncomfortable truths, or because they simply don’t know what to record. This piece solves the third problem. The first two require honesty, and no spreadsheet can provide that.
Essential Columns: What Every NFL Betting Log Needs
I’ve iterated on my tracking spreadsheet for years, stripping away columns that added noise and adding ones that generated insight. Here’s what survives — the minimum viable dataset for serious NFL bet tracking.
Date: when you placed the bet, not when the game kicks off. This matters because you’ll eventually want to analyse whether your timing (early week vs. game day) correlates with better or worse outcomes. A Tuesday bet and a Sunday morning bet on the same game are fundamentally different decisions made with different information.
Game: both teams. Simple, but essential for filtering by team-specific patterns later. You might discover you’re 14-3 on Seahawks games and 4-11 on Chargers games, which reveals a bias worth examining.
Market: spread, moneyline, total, player prop, or futures. Tracking by market type lets you identify which markets you’re sharpest in. My own data shows I’m profitable on spreads and totals but roughly breakeven on player props — which tells me to allocate more of my bankroll to spreads and totals and use props as a supplementary strategy.
Selection: exactly what you bet. “Chiefs -3.5” or “Over 47.5” or “Josh Allen Over 265.5 passing yards.” Be precise. Vague entries like “Chiefs” don’t tell you enough when you revisit the data months later.
Odds: the decimal odds at which you placed the bet. This is non-negotiable. Without the odds, you can’t calculate ROI, expected value, or CLV.
Stake: how much you wagered in pounds, or in units if you prefer. I use units (1 unit = 1% of bankroll at the start of the season) because it normalises stake sizes across bankroll fluctuations.
Result: win, loss, push, or void. No interpretive categories. No “moral victories.” The outcome is binary (or trinary if you include pushes).
Profit/Loss: calculated automatically from odds, stake, and result. This is your bottom line per bet.
Adding Closing Line Value to Your Tracker
Two additional columns transform a basic betting log into a diagnostic tool: Closing Line and CLV.
Closing Line: the odds or spread on your selection at the moment the game kicks off. Record this from the same bookmaker where you placed the bet to avoid cross-platform measurement error. For spread bets, record the closing spread number. For moneyline bets, record the closing decimal odds.
CLV: the difference between your price and the closing price. For spreads, this is measured in points. You got +3.5, line closed at +3 — your CLV is +0.5 points. For moneylines, convert both prices to implied probability and take the difference. You got 2.50 (40%), line closed at 2.30 (43.5%) — your CLV is +3.5 percentage points.
The breakeven threshold for standard -110 spread bets is 52.38%. But a positive average CLV over 100+ bets is a more reliable indicator of genuine skill than win rate alone. CLV stabilises faster because it measures your price relative to the market’s final efficiency, stripping out the noise of game outcomes. I consider CLV the single most important column in the entire spreadsheet — everything else is supporting data for the question that CLV answers: are you consistently smarter than the market?
Weekly and Monthly Reviews: Reading Your Own Data
Collecting data is pointless if you don’t analyse it. I set aside 30 minutes every Monday morning — yes, the morning after the Sunday night and Monday night games — to review the past week’s bets. Here’s what I look at.
First: weekly ROI. How did this week compare to my season average? I don’t react to single-week results — variance is too high — but I note whether I’m on a sustained uptrend or downtrend. Three consecutive negative weeks triggers a deeper review.
Second: average CLV for the week. This is the process check. Even if I lost money, positive CLV means my selections were on the right side of the market. If CLV is negative for three straight weeks, something in my handicapping process has degraded — maybe I’m chasing steam moves too late, or maybe my data sources have become stale.
Third: market-type breakdown. Am I profitable on spreads this month but bleeding on props? Am I winning on unders but losing on overs? These patterns emerge over monthly reviews, not weekly ones, so I track them on a rolling 4-week basis and look for persistent imbalances.
Fourth: timing analysis. Are my early-week bets outperforming my late-week bets? For most sharp bettors, the answer is yes — early lines are softer because they haven’t incorporated the full week’s information flow. If your data shows the opposite (late bets outperform), you might be better at reacting to information than at originating opinions, and you should adjust your process accordingly.
Monthly reviews go deeper. I calculate cumulative ROI and CLV, compare them to the same period in previous seasons, and look for systematic biases. One year, my monthly review revealed that I was 6-18 on primetime games (Thursday, Sunday night, Monday night). I’d been watching those games live, getting emotionally invested in the action, and making worse decisions as a result. That insight — impossible without tracking — led me to either skip primetime bets or place them before kickoff rather than in-play.
Free Tools and Templates for NFL Bet Tracking
You don’t need paid software. A Google Sheet or Excel workbook with the columns described above is more than sufficient for the first two to three seasons of tracking. The simplicity is a feature, not a bug — it forces you to focus on the data that matters rather than getting distracted by dashboards and automated reports.
Set up your spreadsheet with one tab per season. Within each tab, one row per bet. Use conditional formatting to colour-code profitable (green) and unprofitable (red) bets for visual scanning. Add a summary row at the bottom that calculates total profit/loss, total units wagered, ROI percentage, win rate percentage, and average CLV.
For formulas, the essentials are straightforward. ROI = (Total Profit / Total Stakes) x 100. Win Rate = (Wins / Total Bets) x 100. Average CLV = sum of all CLV values / number of bets. These three numbers, updated weekly, give you a complete snapshot of your performance.
If you want to go further, add a pivot table or filter by market type, by team, by day of week, or by time of season. These slices reveal patterns that aggregate numbers hide. I once discovered through a team-level filter that 40% of my annual losses came from games involving two specific teams whose matchups I consistently misjudged. Dropping those teams from my betting slate improved my ROI by nearly 2 percentage points.
The template can be as simple or as detailed as you want. What matters is consistency. Log every bet. Log the closing line. Review the data regularly. This habit — more than any strategy, more than any system, more than any hot tip — is what builds a profitable NFL betting career over time. It’s boring. It’s unglamorous. And it works.
What columns should an NFL betting spreadsheet include?
At minimum: date placed, game (both teams), market type (spread/moneyline/total/prop), exact selection, decimal odds, stake in units or pounds, result (win/loss/push), profit or loss, closing line, and CLV. These columns let you calculate ROI, win rate, average CLV, and filter by market type or team to identify strengths and weaknesses in your handicapping process.
How often should I review my NFL betting performance data?
Weekly for a quick process check (ROI and average CLV for the past 7 days) and monthly for deeper analysis (market-type breakdowns, timing patterns, team-specific results, and cumulative trends). Weekly reviews take about 30 minutes. Monthly reviews take an hour. Three consecutive weeks of negative CLV should trigger a deeper investigation into your handicapping process, even if your win rate looks acceptable.
Written by the editors at nfl Betting Strategies.